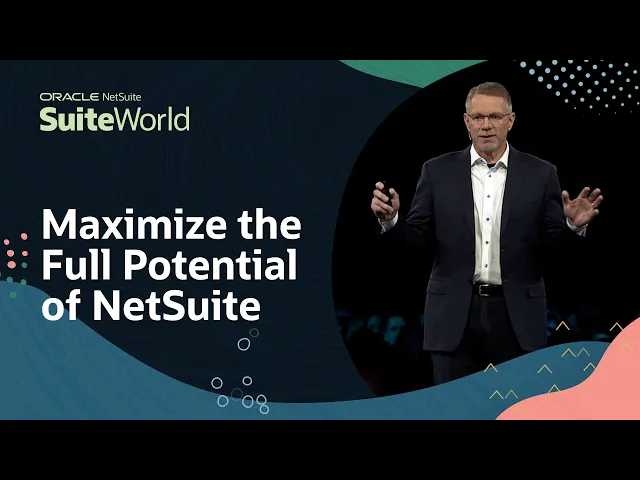
Oracle - Suiteworld Showcase

Capillary Technologies

Supply 360
An AI-assisted supply visibility dashboard helping production managers identify, prioritise, and resolve supply risks early to keep manufacturing schedules on track.

Manufacturing

B2B

Web App

Oracle - Suiteworld Showcase

Capillary Technologies

Supply 360

An AI-assisted supply visibility dashboard helping production managers identify, prioritise, and resolve supply risks early to keep manufacturing schedules on track.

Manufacturing

B2B

Web App

About
About
Brief

Supply360 is an AI-assisted supply chain dashboard designed to help production managers anticipate and resolve supply bottlenecks before they impact production schedules. The system uses data intelligence to prioritize issues based on time, risk, and revenue impact, offering clear recommendations and visibility across factories, components, and vendors.

Project Descriptions

Production managers often struggle to keep factory schedules on track due to fragmented supply data and late visibility into risks.

 Existing systems offered static data views without guidance on what to prioritize or how to act.

 This resulted in:

  • Missed deadlines and delayed production.

  • Manual cross-checking across multiple spreadsheets or systems.

  • Limited foresight into how small delays affect overall revenue impact.

Role

Role

UX Designer

UX Designer

Industry

B2B Manufacturing Domain

Team

1 UX Designer , 1 Product manager, 4 Developers

Timeline

Timeline

2.5 weeks

2.5 weeks

Responsibilities
  1. ??? Secondary Research Study

  2. ?

  3. ??? High Fidelity Design

NetSuite Suiteworld Presentation
About NetSuite SuiteWorld

SuiteWorld is NetSuite’s yearly event where the company highlights its most impactful product developments. This project was selected for a leadership presentation at the conference, signifying its role in shaping the product direction

?????

?????

????/

????/

Understand
Understand
Research Process

Research Process

The foundation of this project was built on understanding the realities of production management where decisions must be made fast, with high accuracy, and often under uncertainty.

The foundation of this project was built on understanding the realities of production management where decisions must be made fast, with high accuracy, and often under uncertainty.

Before any design work, we conducted a deep-dive into the manufacturing and supply chain workflows to understand how production managers, planners, and procurement teams currently operate. We reviewed their existing NetSuite setup, dashboards, and reporting tools to identify friction points.


We realized that while data existed in abundance, the visibility and usability of that data were fragmented. Production managers were often juggling spreadsheets, vendor reports, and ERP dashboards without a unified view.

Before any design work, we conducted a deep-dive into the manufacturing and supply chain workflows to understand how production managers, planners, and procurement teams currently operate. We reviewed their existing NetSuite setup, dashboards, and reporting tools to identify friction points.


We realized that while data existed in abundance, the visibility and usability of that data were fragmented. Production managers were often juggling spreadsheets, vendor reports, and ERP dashboards without a unified view.

Current Situation

Current Situation

Production managers often struggle to keep factory schedules on track due to fragmented supply data and late visibility into risks.

 Existing systems offered static data views without guidance on what to prioritize or how to act.

 This resulted in:

  • Missed deadlines and delayed production.

  • Manual cross-checking across multiple spreadsheets or systems.

  • Limited foresight into how small delays affect overall revenue impact.

Production managers often struggle to keep factory schedules on track due to fragmented supply data and late visibility into risks.

 Existing systems offered static data views without guidance on what to prioritize or how to act.

 This resulted in:

  • Missed deadlines and delayed production.

  • Manual cross-checking across multiple spreadsheets or systems.

  • Limited foresight into how small delays affect overall revenue impact.

Discover - Understanding Context (Problem Context)

??????

??????

Understanding the users
Interview and recordings

Interview and recordings

Key Insights:

  • Most managers relied on manual methods or personal heuristics to prioritize issues.

  • “Critical” issues were often discovered too late, when a work order was already delayed.

  • They expressed frustration with data overload — too much information, but no clarity on what matters most right now.

  • There was low trust in AI or automation, primarily because current tools did not explain their recommendations.

Key Insights:

  • Most managers relied on manual methods or personal heuristics to prioritize issues.

  • “Critical” issues were often discovered too late, when a work order was already delayed.

  • They expressed frustration with data overload — too much information, but no clarity on what matters most right now.

  • There was low trust in AI or automation, primarily because current tools did not explain their recommendations.

One participant summarized it best:
“We have all the data, but not the direction. I want the system to tell me what to care about today.”

One participant summarized it best:
“We have all the data, but not the direction. I want the system to tell me what to care about today.”

Understanding Users

Understanding Users

1. Who are the users?

Primary users are production managers working in large, US-based manufacturing plants who are directly accountable for meeting daily and weekly production targets. Secondary users include supply chain and planning managers who support production decisions but are not responsible for day-to-day execution.

Primary users are production managers working in large, US-based manufacturing plants who are directly accountable for meeting daily and weekly production targets. Secondary users include supply chain and planning managers who support production decisions but are not responsible for day-to-day execution.

2. What experience do they have?

Users were comfortable with manufacturing concepts but:

  • Hesitated when navigating complex reports

  • Cross-checked information across multiple screens

  • Relied on memory and spreadsheets to fill gaps

Users were comfortable with manufacturing concepts but:

  • Hesitated when navigating complex reports

  • Cross-checked information across multiple screens

  • Relied on memory and spreadsheets to fill gaps

5. What are their real goals?

While users initially stated goals like “keeping production on track,” deeper conversations revealed emotional drivers:

  • Avoiding last-minute escalations

  • Reducing stress at the end of the day

  • Feeling confident leaving the plant knowing tomorrow is stable

  1. In what form do they want information presented?

Users responded best to:

  • High-level summaries with drill-down options

  • Visual indicators of urgency

  • Clear status changes after actions

Long tables and dense reports were often skipped unless users were investigating a known issue.

4. How do users expect the system to work?

Users described their ideal system as one that:

  • Surfaces problems automatically

  • Explains why an issue matters

  • Suggests what action to take

3. What information do they actually need?
  1. Which supply issues will impact production soon

  2. Which issue has the biggest business impact

  3. Whether action is needed today or can wait

Pain Point Synthesis

Using insights from recording of users, We grouped user pain points into four key categories:

  1. Visibility - Users struggled to get a forward-looking view of supply health

  2. Prioritisation - No clear hierarchy of which issues impact revenue or timelines most

  3. Decision Support - Lack of actionable insights or recommendations within existing toolsZ

  4. Trust in AI - Skepticism towards automated suggestions due to lack of transparency.


These insights shaped our core design goals — to create an interface that not only visualizes problems but also builds trust through clarity, transparency, and contextual guidance.

Using insights from recording of users, We grouped user pain points into four key categories:

  1. Visibility - Users struggled to get a forward-looking view of supply health

  2. Prioritisation - No clear hierarchy of which issues impact revenue or timelines most

  3. Decision Support - Lack of actionable insights or recommendations within existing toolsZ

  4. Trust in AI - Skepticism towards automated suggestions due to lack of transparency.


These insights shaped our core design goals — to create an interface that not only visualizes problems but also builds trust through clarity, transparency, and contextual guidance.

Define
Define
User Flow Diagram
User Flow Diagram

Based on the insights and data gathered from our research, we developed the following user flow diagram for all sync flows for this phase:

Based on the insights and data gathered from our research, we developed the following user flow diagram for all sync flows for this phase:

Workflow Mapping
Workflow Mapping

Using insights from interviews, we mapped the current-state journey of a production manager from detecting an issue to executing a fix.

 We identified major friction points at:

  • Detection: Supply risks surfaced late or inconsistently.

  • Prioritization: Difficulty comparing which issue had higher business impact.

  • Action: Decisions required cross-team dependencies and data validation.

This mapping became crucial for defining design opportunities — our dashboard needed to compress this multi-step journey into one cohesive flow: See → Understand → Act.

Using insights from interviews, we mapped the current-state journey of a production manager from detecting an issue to executing a fix.

 We identified major friction points at:

  • Detection: Supply risks surfaced late or inconsistently.

  • Prioritization: Difficulty comparing which issue had higher business impact.

  • Action: Decisions required cross-team dependencies and data validation.

This mapping became crucial for defining design opportunities — our dashboard needed to compress this multi-step journey into one cohesive flow: See → Understand → Act.

Framing the solution
🔐 Build a predictive alert system that surfaces upcoming risks
✨Provide multi-level visibility for quick root-cause diagnosis
⚡ Introduce AI explainability to increase confidence in recommendations
🤖 ????????/
Develop
Develop
Designs

Designs

Sed ut perspiciatis unde omnisSed ut perspiciatis unde omnis iste natus error sit voluptatem accusantium doloremque laudantium, totam rem aperiam, eaque ipsa quae ab illo inventore veritatis et quasi architecto beatae vitae dicta sunt explicabo. Nemo enim ipsam voluptatem quia voluptas

Sed ut perspiciatis unde omnisSed ut perspiciatis unde omnis iste natus error sit voluptatem accusantium doloremque laudantium, totam rem aperiam, eaque ipsa quae ab illo inventore veritatis et quasi architecto beatae vitae dicta sunt explicabo. Nemo enim ipsam voluptatem quia voluptas

  1. Dashboard Screen
  1. Drill down Table
  1. ????
  1. ????
Key Takeaways & Learnings
👥 AI needs explainability to be trusted by enterprise users
📚 Designing for decision-making clarity often yields more business value than visual innovation
🏛️ Information hierarchy is critical when visualizing dense operational data

"Curiosity is the Compass.
Design is the Direction"

©Rahul Salunke 2026

"Curiosity is the Compass.
Design is the Direction"

©Rahul Salunke 2026

"Curiosity is the Compass.
Design is the Direction"

©Rahul Salunke 2026

"Curiosity is the Compass.
Design is the Direction"

©Rahul Salunke 2026